
The chart below gives information about how families in one country spent their weekly income in 1968 and 2018.
The chart below gives information about how families in one country spent their weekly income in 1968 and 2018.
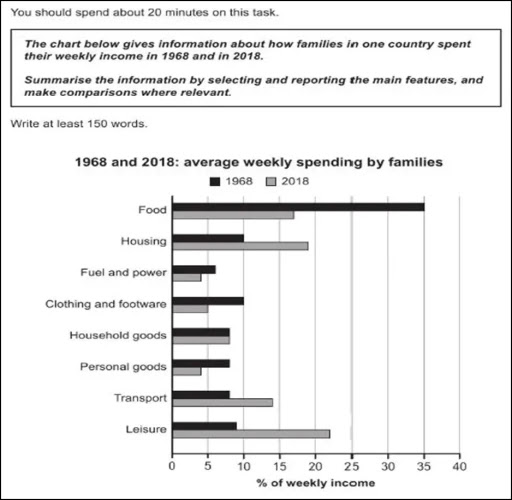
Summarise the information by selecting and reporting the main features, and make comparisons where relevant.
For-5.5
The bar chart provides information about a specific countrie's people use their income for their families between 1968 to 2018.
Overall, in 1964, people spending their savings more to buying food than other items while in 2018, it seems quit different where leisure is higher than food. The rate of both period has some fluctuations.
In 1968,or the purpose of food 35% of earnings are put out which is around 18% higher than 2018.Then it decrease gradually 10% for housing and clothing and footwear. Almost 9% of their revenue pour for leisure while owing to transport, personal goods and household goods are almost 7% individually. Finally, it hits the last percentage of spending their income more than 5% for fuel and power.
Percentage of expending money for leisure is highest in 2018 and next to housing and food respectably almost 20% and 17%.Then it gradually decreased for transport, household goods and cloth and footwear respectably nearly 14%, 8% and 5%.This rate reached at the bottom of the expenditure percentage for fuael and power and personal goods are individually less than 5%.
for-7
The bar chart provides information about how people in a specific country allocated their income for their families from 1968 to 2018.
Overall, in 1968, people spent a larger portion of their savings on food compared to other items. However, by 2018, this trend had changed significantly, as leisure spending surpassed food expenses. The expenditure rates for both periods displayed some fluctuations.
In 1968, approximately 35% of earnings were allocated for food, which is around 18% higher than in 2018. Spending on housing and clothing/footwear decreased gradually to about 10%. Nearly 9% of their income was dedicated to leisure, while spending on transport, personal goods, and household goods constituted around 7% each. Lastly, the expenditure on fuel and power accounted for just over 5%.
In 2018, the percentage spent on leisure was the highest, followed by housing and food, which were approximately 20% and 17%, respectively. This was followed by a gradual decrease in spending for transport, household goods, and clothing/footwear, which accounted for about 14%, 8%, and 5%. The lowest percentages of expenditure were for fuel and power, as well as personal goods, both of which were individually less than 5%.
For-9
The bar chart illustrates the allocation of weekly household income by families in a specific country during the years 1968 and 2018.
It is evident that there has been a significant shift in spending patterns over the five-decade period, most notably in the decrease of expenditure on food and the increase in housing and transport costs.
In 1968, families allocated the largest portion of their income to food, which constituted nearly 35% of their total expenditure. This was followed by housing, which accounted for approximately 15%. Other categories such as fuel and power, clothing and footwear, personal goods, and leisure each represented less than 10% of the overall spending, with household goods capturing around 5%. Notably, the allocation towards food was substantially higher than it was five decades later, indicating a shift in consumption priorities.
By 2018, the expenditure landscape had transformed considerably. Food expenditure dropped to roughly 15%, while housing costs surged to over 25%, reflecting a growing emphasis on accommodation expenses. Transport also experienced a notable increase, rising from about 10% in 1968 to over 30% in 2018. In contrast, other categories exhibited minimal changes, with fuel and power, clothing and footwear, personal goods, and leisure all remaining below 10%. Notably, household goods constituted around 5%, illustrating relatively stable spending in this category over the years.


Comments
Post a Comment
Thanks